

When you do meta-analysis you usually visualize your results using a so-called forest plot. The plot is automatically available in the packages denoted for meta-analysis (such as meta), but there are times you would like to plot it “from the scratch” and completely customize it. After struggling a bit with ggplot2 you discover forestplot package getting mad that you wasted so much time. But before getting so much enthusiastic about the new package read below:)
The forestplot function allows you to code the plot visible below.
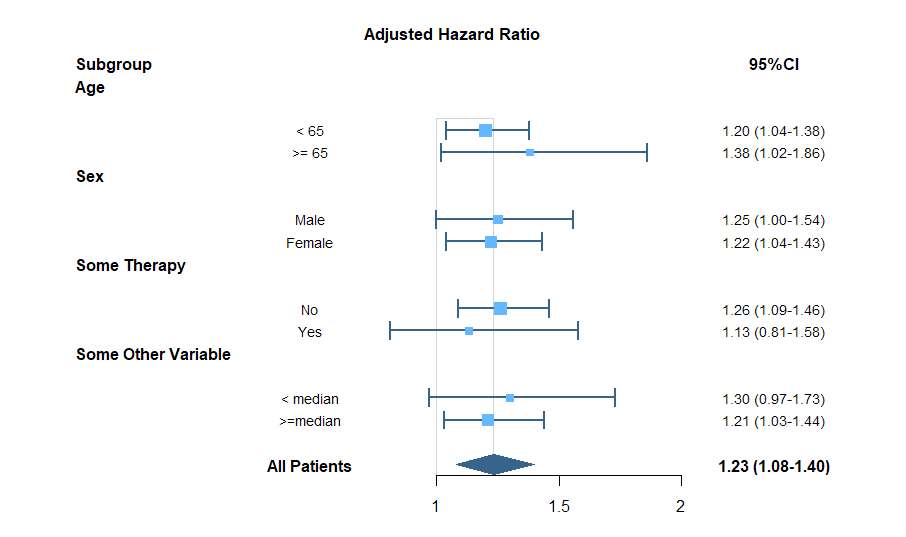
The bold headings are made using is.summary argument in the forestplot() function. Whenever you put TRUE in a vector a given line will be bolded. But keep in mind that the whole line will be also formatted. In particular, if this is the last line it will be treated as the summary for all patients. So if for some reason you would like to have all effects of the same sizes and shapes you cannot use is.summary() function. And the price to pay is losing bold headings, except the title, just like on the plot below.
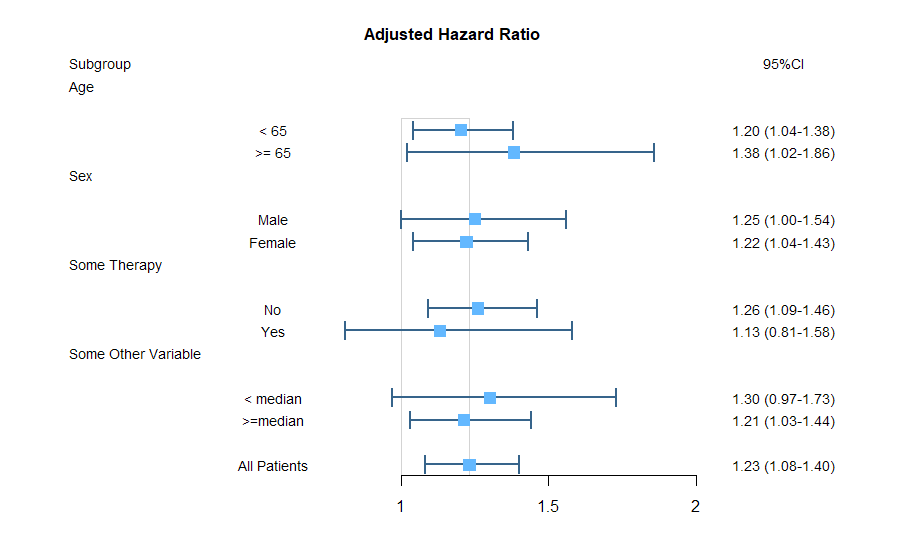
Sorry:( If you know the trick message me in the comments.