

We all know the common OLS regression linear models. In this kind of models we assume that Y depends linearly on some let us assume continous predictor X plus and we account for the measurment error for Y as:
Y_i=A+B*X_i,
i is the index of the i-th observation on X and Y.
Note that from this regression model, since there is only one predictor, the linear correlation coefficient R can be estimated as:
r=R=sqrt(R^2).
Also note that testing H0:r=0 is equivalent to testing H0:B=0.
X can be for example the time spent on studing for the i-th student and X his/her score on the exam.
Ideally, the longer X the higher Y, so the B coefficent is supposed to be positive.
The way to fit that model in R is via function:
lm(Y~X, data=my.data)But what if we for example want to compare two devices Dev1 and Dev2. We measure the same thing on Dev1 and Dev2. As the result we get the vector of measures for the Dev1 (X1) and Dev2 (X2). The way to assess the agreement between these two machines is via so called Deming regression. This regression is something similar to OLS regression, but it assumes that both Y and X are measured with error.
Therefore, for the first device Dev1 we have:
X1_i=A1+B1*TrueX1_i+E2_i
And for the second device DEV2:
X2_i=A2+B2*TrueX2_i+E2_i.
In the above equations E1 and E2 are the measurment errors.
We assume that those error vectors are normally distributted with N(0,sigma1^2) and N(0,sigma2^2). In addition, we define the lambda=sigma1^2/sigma2^2.
The lambda is the ratio of the variance for the two measurments errors. Typically we assume lambda=1 so that none of the machines are in favor. The way to fit the Deming regression in R is via the package mcr.
Below I wrote a function that draws the result of the Deming regression that is fitted via mcreg function.
It also return the obtained slope and intercept from the model.
Draw.Deming.Plot<-function(resp1,resp2,name1){
  #mcreg does not accept NAs
  df<-as.data.frame(cbind(resp1,resp2))
  df2<-df[complete.cases(df),]
  dem.reg <- mcreg(df2$resp1,df2$resp2, error.ratio = 1, method.reg = "Deming")
  MCResult.plot(dem.reg, equal.axis = TRUE, x.lab = " Device 1", y.lab = "Device 2", points.col = "#FF7F5060", points.pch = 19, ci.area = TRUE, ci.area.col = "#0000FF50", main = paste("Deming Regression for ",name1), sub = "", add.grid = FALSE, points.cex = 1)
  return(list(intercept=c(dem.reg@para[1,c(1,3,4)]),slope=c(dem.reg@para[2,c(1,3,4)])))
}
Let us see the the plot that is produced for the example data resp1 and resp2.
resp1<-c(1,1.2,2,3,4,4.1,5,5.1)
resp2<-c(1,1.3,2.2,3.1,4,4.2,5.1,5.5)
Draw.Deming.Plot(resp1,resp2,"My Experiment")
We get:
$intercept
        EST         LCI         UCI
 0.01532475 -0.18087790  0.19446184

$slope
      EST       LCI       UCI
1.0345434 0.9672911 1.0910989
And the plot:
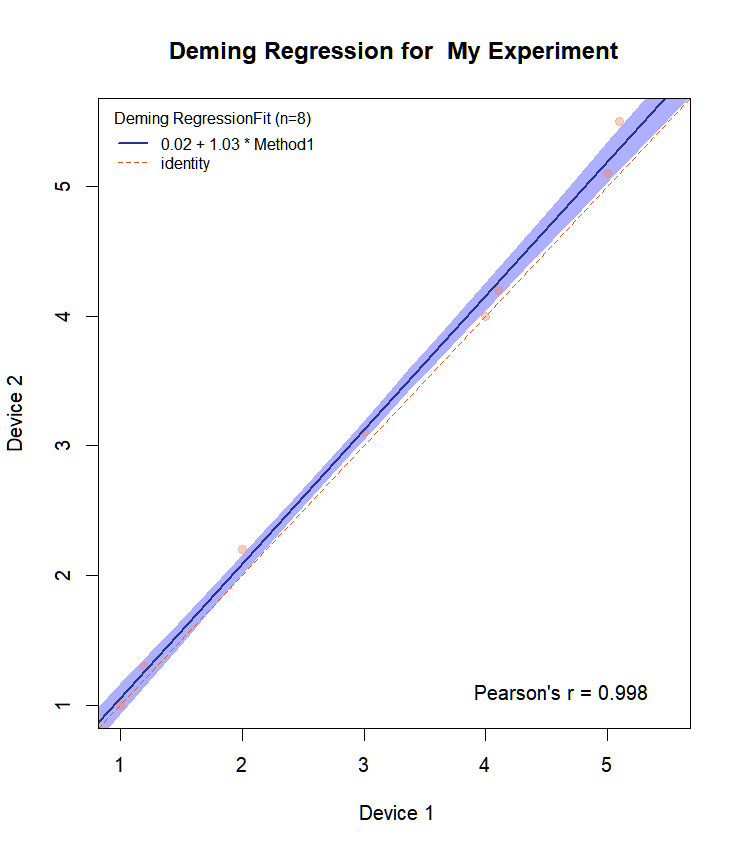
We observe that the above agreement is almost perfect for this toy data. Slope equals 1 with CI: 0.97-1.09. Function MCResult.plot plots by default also the confidence bounds in the chosen color. It also puts the equation on the plot.
If one wants to put also the CI for the slope and intercept on the plot, here is the modification of the MCResult.plot() function:
MCResult.plot2<-function (x, alpha = 0.05, xn = 20, equal.axis = FALSE, xlim = NULL,
          ylim = NULL, xaxp = NULL, yaxp = NULL, x.lab = x@mnames[1],
          y.lab = x@mnames[2], add = FALSE, draw.points = TRUE, points.col = "black",
          points.pch = 1, points.cex = 0.8, reg = TRUE, reg.col = NULL,
          reg.lty = 1, reg.lwd = 2, identity = TRUE, identity.col = NULL,
          identity.lty = 2, identity.lwd = 1, ci.area = TRUE, ci.area.col = NULL,
          ci.border = FALSE, ci.border.col = NULL, ci.border.lty = 2,
          ci.border.lwd = 1, add.legend = TRUE, legend.place = c("topleft",
                                                                 "topright", "bottomleft", "bottomright"), main = NULL,
          sub = NULL, add.cor = TRUE, cor.method = c("pearson", "kendall",
                                                     "spearman"), add.grid = TRUE, digits = list(coef = 2,
                                                                                                 cor = 3), ...)
{
  stopifnot(is.logical(reg))
  stopifnot(is.logical(ci.area))
  stopifnot(is.logical(identity))
  stopifnot(is.logical(ci.border))
  stopifnot(is.logical(add.cor))
  stopifnot(is.logical(add.grid))
  stopifnot(is.logical(draw.points))
  stopifnot(is.logical(add.legend))
  stopifnot(is.numeric(alpha))
  stopifnot(alpha > 0 & alpha < 1)
  if (is.null(digits)) {
    digits = list(coef = 2, cor = 3)
  }
  stopifnot(sum(names(digits) %in% c("coef", "cor")) >= length(names(digits)))
  if (is.null(digits$coef)) {
    digits$coef <- 2
  }
  if (is.null(digits$cor)) {
    digits$cor <- 3
  }
  cor.method <- match.arg(cor.method)
  stopifnot(is.element(cor.method, c("pearson", "kendall",
                                     "spearman")))
  legend.place <- match.arg(legend.place)
  stopifnot(is.element(legend.place, c("topleft", "topright",
                                       "bottomleft", "bottomright")))
  if (length(points.col) > 1)
    stopifnot(length(points.col) == nrow(x@data))
  if (length(points.pch) > 1)
    stopifnot(length(points.pch) == nrow(x@data))
  if (x@regmeth == "LinReg")
    titname <- "Linear Regression"
  else if (x@regmeth == "WLinReg")
    titname <- "Weighted Linear Regression"
  else if (x@regmeth == "TS")
    titname <- "Theil-Sen Regression"
  else if (x@regmeth == "PBequi")
    titname <- "Equivariant Passing-Bablok Regression"
  else if (x@regmeth == "Deming")
    titname <- "Deming Regression"
  else if (x@regmeth == "WDeming")
    titname <- "Weighted Deming Regression"
  else titname <- "Passing Bablok Regression"
  niceblue <- rgb(37/255, 52/255, 148/255)
  niceor <- rgb(230/255, 85/255, 13/255)
  niceblue.bounds <- rgb(236/255, 231/255, 242/255)
  if (is.null(reg.col))
    reg.col <- niceblue
  if (is.null(identity.col))
    identity.col <- niceor
  if (is.null(ci.area.col))
    ci.area.col <- niceblue.bounds
  if (is.null(ci.border.col))
    ci.border.col <- niceblue
  stopifnot(is.numeric(xn))
  stopifnot(round(xn) == xn)
  stopifnot(xn > 1)
  if (is.null(xlim))
    rx <- range(x@data[, "x"], na.rm = TRUE)
  else rx <- xlim
  tmp.range <- range(as.vector(x@data[, c("x", "y")]), na.rm = TRUE)
  if (equal.axis == TRUE) {
    if (is.null(ylim)) {
      yrange <- tmp.range
    }
    else {
      yrange <- ylim
    }
  }
  else {
    if (is.null(ylim)) {
      yrange <- range(as.vector(x@data[, "y"]), na.rm = TRUE)
    }
    else {
      yrange <- ylim
    }
  }
  if (!is.null(xlim) && !is.null(ylim) && equal.axis) {
    xlim <- c(min(c(xlim[1], ylim[1])), max(c(xlim[2], ylim[2])))
  }
  if (is.null(xaxp)) {
    if (!is.null(xlim)) {
      axis_ticks <- axisTicks(c(xlim[1] - 0.05 * xlim[2],
                                ceiling((xlim[2] + 0.05 * xlim[2]) * 10^digits$coef)/10^digits$coef),
                              log = F, nint = 7)
      xaxp <- c(axis_ticks[1], tail(axis_ticks, n = 1),
                length(axis_ticks) - 1)
      xlim <- c(axis_ticks[1], tail(axis_ticks, n = 1))
    }
  }
  else {
    if (!is.null(xlim)) {
      if ((xlim[1] == rx[1] && xlim[2] == rx[2]) | (tmp.range[1] ==
                                                    xlim[1] && tmp.range[2] == xlim[2])) {
        xlim <- c(xaxp[1], xaxp[2])
      }
    }
    else {
      warning("xaxp should never be set without xlim")
      xaxp <- NULL
    }
  }
  if (is.null(yaxp)) {
    if (!is.null(ylim) && !equal.axis) {
      yaxp <- axis_ticks <- axisTicks(c(ylim[1] - 0.05 *
                                          ylim[2], ceiling((ylim[2] + 0.05 * ylim[2]) *
                                                             10^digits$coef)/10^digits$coef), log = F, nint = 10)
      yaxp = c(axis_ticks[1], tail(axis_ticks, n = 1),
               length(axis_ticks) - 1)
      ylim <- c(axis_ticks[1], tail(axis_ticks, n = 1))
    }
    else {
      if (equal.axis) {
        if (!is.null(xlim)) {
          yaxp <- xaxp
          ylim <- xlim
        }
      }
    }
  }
  else {
    if (!is.null(ylim)) {
      if ((ylim[1] == yrange[1] && ylim[2] == yrange[2]) |
          (tmp.range[1] == ylim[1] && tmp.range[2] == ylim[2])) {
        ylim <- c(yaxp[1], yaxp[2])
      }
    }
    else {
      warning("yaxp should never be set without ylim")
      yaxp <- NULL
    }
  }
  if (equal.axis) {
    if (is.null(ylim)) {
      yaxp <- xaxp
      ylim <- xlim
    }
    if (is.null(xlim)) {
      xaxp <- yaxp
      xlim <- ylim
    }
  }
  if (!is.null(xlim)) {
    if (xlim[1] < tmp.range[1]) {
      tmp.range[1] <- xlim[1]
    }
    if (xlim[2] > tmp.range[2]) {
      tmp.range[2] <- xlim[2]
    }
  }
  if (!is.null(ylim)) {
    if (ylim[1] < yrange[1]) {
      yrange[1] <- ylim[1]
    }
    if (ylim[2] > yrange[2]) {
      yrange[2] <- ylim[2]
    }
  }
  xd <- seq(rx[1], rx[2], length.out = xn)
  xd <- union(xd, rx)
  delta <- abs(rx[1] - rx[2])/xn
  xd <- xd[order(xd)]
  xd.add <- c(xd[1] - delta * 1:10, xd, xd[length(xd)] + delta *
                1:10)
  if (is.null(xlim))
    xlim <- rx
  if (ci.area == TRUE | ci.border == TRUE) {
    bounds <- calcResponse(x, alpha = alpha, x.levels = xd)
    bounds.add <- calcResponse(x, alpha = alpha, x.levels = xd.add)
    if (equal.axis == TRUE) {
      xd <- seq(tmp.range[1], tmp.range[2], length.out = xn)
      xd <- union(xd, tmp.range)
      delta <- abs(rx[1] - rx[2])/xn
      xd <- xd[order(xd)]
      xd.add <- c(xd[1] - delta * 1:10, xd, xd[length(xd)] +
                    delta * 1:10)
      bounds <- calcResponse(x, alpha = alpha, x.levels = xd)
      bounds.add <- calcResponse(x, alpha = alpha, x.levels = xd.add)
      yrange <- range(c(as.vector(x@data[, c("x", "y")]),
                        as.vector(bounds[, c("X", "Y", "Y.LCI", "Y.UCI")])),
                      na.rm = TRUE)
    }
    else {
      yrange <- range(c(as.vector(x@data[, "y"]), as.vector(bounds[,
                                                                   c("Y", "Y.LCI", "Y.UCI")])), na.rm = TRUE)
    }
  }
  else {
    if (equal.axis == TRUE) {
      yrange <- tmp.range
    }
    else {
      yrange <- range(as.vector(x@data[, "y"]), na.rm = TRUE)
    }
  }
  if (equal.axis) {
    if (is.null(ylim)) {
      xlim <- ylim <- tmp.range
    }
    else {
      xlim <- ylim
    }
  }
  else {
    if (is.null(xlim))
      xlim <- rx
    if (is.null(ylim))
      ylim <- yrange
  }
  if (is.null(main))
    main <- paste(titname, "Fit")
  if (!add) {
    plot(0, 0, cex = 0, ylim = ylim, xlim = xlim, xlab = x.lab,
         ylab = y.lab, main = main, sub = "", xaxp = xaxp,
         yaxp = yaxp, bty = "n", ...)
  }
  else {
    sub <- ""
    add.legend <- FALSE
    add.grid <- FALSE
  }
  if (add.legend == TRUE) {
    if (identity == TRUE & reg == TRUE) {
      text2 <- "identity"
      text1 <- paste(formatC(round(x@para["Intercept",
                                          "EST"], digits = digits$coef), digits = digits$coef,
                             format = "f"),"(",formatC(round(x@para["Intercept",
                                                                    "LCI"], digits = digits$coef), digits = digits$coef,
                                                       format = "f"),";",formatC(round(x@para["Intercept",
                                                                                          "UCI"], digits = digits$coef), digits = digits$coef,
                                                                             format = "f"),")"," + ", formatC(round(x@para["Slope",
                                                                        "EST"], digits = digits$coef), digits = digits$coef,
                                                           format = "f"),"(",formatC(round(x@para["Slope",
                                                                                                  "LCI"], digits = digits$coef), digits = digits$coef,
                                                                                     format = "f"),";",formatC(round(x@para["Slope",
                                                                                                                        "UCI"], digits = digits$coef), digits = digits$coef,
                                                                                                           format = "f"),")" ," * ", x@mnames[1], sep = "")
      legend(legend.place, lwd = c(reg.lwd, identity.lwd),
             lty = c(reg.lty, identity.lty), col = c(reg.col,
                                                     identity.col), title = paste(titname, "Fit (n=",
                                                                                  dim(x@data)[1], ")", sep = ""), legend = c(text1,
                                                                                                                             text2), box.lty = "blank", cex = 0.8, bg = "white",
             inset = c(0.01, 0.01))
    }
    if (identity == TRUE & reg == FALSE) {
      text2 <- "identity"
      legend(legend.place, lwd = identity.lwd, lty = identity.lty,
             col = identity.col, title = paste(titname, "Fit (n=",
                                               dim(x@data)[1], ")", sep = ""), legend = text2,
             box.lty = "blank", cex = 0.8, bg = "white", inset = c(0.01,
                                                                   0.01))
    }
    if (identity == FALSE & reg == TRUE) {
      text1 <- paste(formatC(round(x@para["Intercept",
                                          "EST"], digits = digits$coef), digits = digits$coef,
                             format = "f"), "+", formatC(round(x@para["Slope",
                                                                      "EST"], digits = digits$coef), digits = digits$coef,
                                                         format = "f"), "*", x@mnames[1], sep = "")
      legend(legend.place, lwd = c(2), col = c(reg.col),
             title = paste(titname, "Fit (n=", dim(x@data)[1],
                           ")", sep = ""), legend = c(text1), box.lty = "blank",
             cex = 0.8, bg = "white", inset = c(0.01, 0.01))
    }
  }
  if (ci.area == TRUE | ci.border == TRUE) {
    if (ci.area == TRUE) {
      xxx <- c(xd.add, xd.add[order(xd.add, decreasing = TRUE)])
      yy1 <- c(as.vector(bounds.add[, "Y.LCI"]))
      yy2 <- c(as.vector(bounds.add[, "Y.UCI"]))
      yyy <- c(yy1, yy2[order(xd.add, decreasing = TRUE)])
      polygon(xxx, yyy, col = ci.area.col, border = "white",
              lty = 0)
    }
    if (add.grid)
      grid()
    if (ci.border == TRUE) {
      points(xd.add, bounds.add[, "Y.LCI"], lty = ci.border.lty,
             lwd = ci.border.lwd, type = "l", col = ci.border.col)
      points(xd.add, bounds.add[, "Y.UCI"], lty = ci.border.lty,
             lwd = ci.border.lwd, type = "l", col = ci.border.col)
    }
    if (is.null(sub)) {
      if (x@cimeth %in% c("bootstrap", "nestedbootstrap"))
        subtext <- paste("The ", 1 - x@alpha, "-confidence bounds are calculated with the ",
                         x@cimeth, "(", x@bootcimeth, ") method.", sep = "")
      else if ((x@regmeth == "PaBa") & (x@cimeth == "analytical"))
        subtext <- ""
      else subtext <- paste("The ", 1 - x@alpha, "-confidence bounds are calculated with the ",
                            x@cimeth, " method.", sep = "")
    }
    else subtext <- sub
  }
  else {
    if (add.grid)
      grid()
    subtext <- ifelse(is.null(sub), "", sub)
  }
  if (add.cor == TRUE) {
    cor.coef <- paste(formatC(round(cor(x@data[, "x"], x@data[,
                                                              "y"], use = "pairwise.complete.obs", method = cor.method),
                                    digits = digits$cor), digits = digits$cor, format = "f"))
    if (cor.method == "pearson")
      cortext <- paste("Pearson's r = ", cor.coef, sep = "")
    if (cor.method == "kendall")
      cortext <- bquote(paste("Kendall's ", tau, " = ",
                              .(cor.coef), sep = ""))
    if (cor.method == "spearman")
      cortext <- bquote(paste("Spearman's ", rho, " = ",
                              .(cor.coef), sep = ""))
    mtext(side = 1, line = -2, cortext, adj = 0.9, font = 1)
  }
  if (draw.points == TRUE) {
    points(x@data[, 2:3], col = points.col, pch = points.pch,
           cex = points.cex, ...)
  }
  title(sub = subtext)
  if (reg == TRUE) {
    b0 <- x@para["Intercept", "EST"]
    b1 <- x@para["Slope", "EST"]
    abline(b0, b1, lty = reg.lty, lwd = reg.lwd, col = reg.col)
  }
  if (identity == TRUE) {
    abline(0, 1, lty = identity.lty, lwd = identity.lwd,
           col = identity.col)
  }
  box()
}
If we change the function now:
Draw.Deming.Plot<-function(resp1,resp2,name1){
  #mcreg does not accept NAs
  df<-as.data.frame(cbind(resp1,resp2))
  df2<-df[complete.cases(df),]
  dem.reg <- mcreg(df2$resp1,df2$resp2, error.ratio = 1, method.reg = "Deming")
  MCResult.plot2(dem.reg, equal.axis = TRUE, x.lab = " Device 1", y.lab = "Device 2", points.col = "#FF7F5060", points.pch = 19, ci.area = TRUE, ci.area.col = "#0000FF50", main = paste("Deming Regression for ",name1), sub = "", add.grid = FALSE, points.cex = 1)
  return(list(intercept=c(dem.reg@para[1,c(1,3,4)]),slope=c(dem.reg@para[2,c(1,3,4)])))
}
And we call:
Draw.Deming.Plot(resp1,resp2,"My Experiment")Then we get:
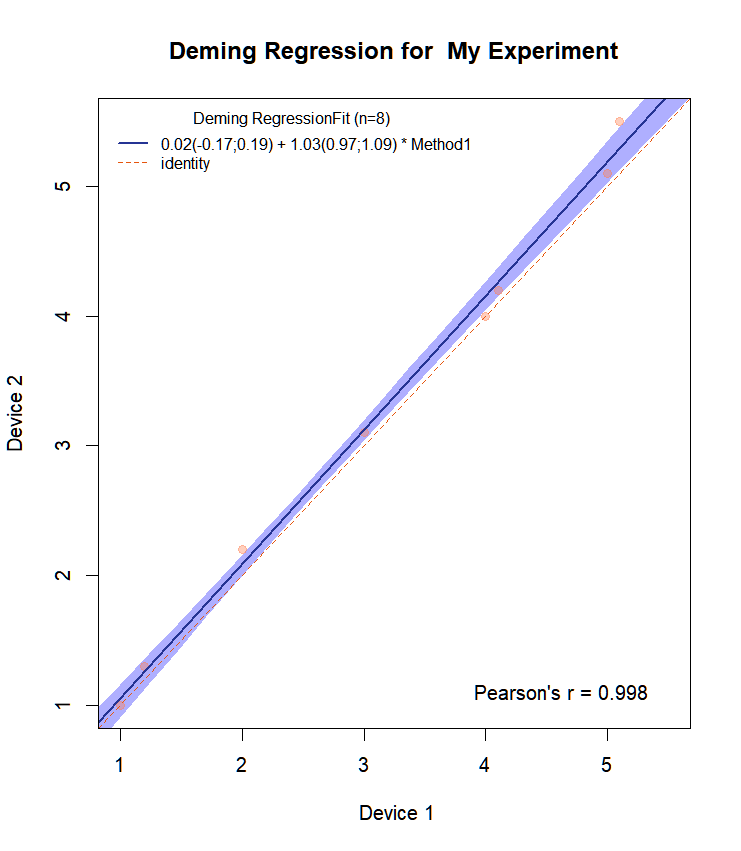
It has now all CI for the slope and intercept on the plot.
Have fun!