

We kennen allemaal de gebruikelijke lineaire OLS regressiemodellen. In dit soort modellen nemen we aan dat Y lineair afhangt van een, laten we aannemen, continue voorspeller X plus en we houden rekening met de meetfout voor Y als:
Y_i=A+B*X_i,
i de index van de i-de waarneming op X en Y is.
Merk op dat uit dit regressiemodel, aangezien er maar één voorspeller is, de lineaire correlatiecoëfficiënt R kan worden geschat als:
r=R=sqrt(R^2).
Merk ook op dat het testen van H0:r=0 gelijk is aan het testen van H0:B=0.
X kan bijvoorbeeld de studietijd van de i-de student zijn en X zijn score op het examen.
Hoe langer X, hoe hoger Y, dus de B-coëfficiënt zou positief moeten zijn.
De manier om dat model in R te passen is via een functie:
lm(Y~X, gegevens=mijn.gegevens)Maar wat als we bijvoorbeeld twee apparaten Dev1 en Dev2 willen vergelijken. We meten hetzelfde op Dev1 en Dev2. Als resultaat krijgen we de vector van metingen voor de Dev1 (X1) en Dev2 (X2). De manier om de overeenkomst tussen deze twee machines te beoordelen is via zogenaamde Deming regressie. Deze regressie is vergelijkbaar met OLS-regressie, maar gaat ervan uit dat zowel Y als X gemeten worden met fouten.
Daarom hebben we voor het eerste apparaat Dev1:
X1_i=A1+B1*TrueX1_i+E2_i
En voor het tweede apparaat DEV2:
X2_i=A2+B2*TrueX2_i+E2_i.
In de bovenstaande vergelijkingen zijn E1 en E2 de meetfouten.
We nemen aan dat die foutvectoren normaal verdeeld zijn met N(0,sigma1^2) en N(0,sigma2^2). Bovendien definiëren we de lambda=sigma1^2/sigma2^2.
De lambda is de verhouding van de variantie voor de twee meetfouten. Gewoonlijk nemen we lambda=1 aan, zodat geen van de machines in het voordeel is. De manier om de Deming-regressie in R te passen is via het pakket mcr.
Hieronder heb ik een functie geschreven die het resultaat tekent van de Deming-regressie die is uitgevoerd met de mcreg-functie.
Het geeft ook de verkregen helling en intercept van het model terug.
Draw.Deming.Plot<-functie(resp1,resp2,naam1){
  #mcreg accepteert geen NA's
  df<-as.data.frame(cbind(resp1,resp2))
  df2<-df[complete.cases(df),]
  dem.reg <- mcreg(df2$resp1,df2$resp2, error.ratio = 1, method.reg = "Deming")
  MCResult.plot(dem.reg, equal.axis = TRUE, x.lab = " Apparaat 1", y.lab = "Apparaat 2", points.col = "#FF7F5060", points.pch = 19, ci.area = TRUE, ci.area.col = "#0000FF50", main = paste("Deming Regression for ",name1), sub = "", add.grid = FALSE, points.cex = 1)
  return(list(intercept=c(dem.reg@para[1,c(1,3,4)]),slope=c(dem.reg@para[2,c(1,3,4)]))
}
Laten we eens kijken naar de plot die is gemaakt voor de voorbeeldgegevens resp1 en resp2.
resp1<-c(1,1.2,2,3,4,4.1,5,5.1)
resp2<-c(1,1.3,2.2,3.1,4,4.2,5.1,5.5)
Draw.Deming.Plot(resp1,resp2,"Mijn experiment")
We krijgen:
$intercept
        EST LCI UCI
 0.01532475 -0.18087790 0.19446184

$helling
      EST LCI UCI
1.0345434 0.9672911 1.0910989
En de plot:
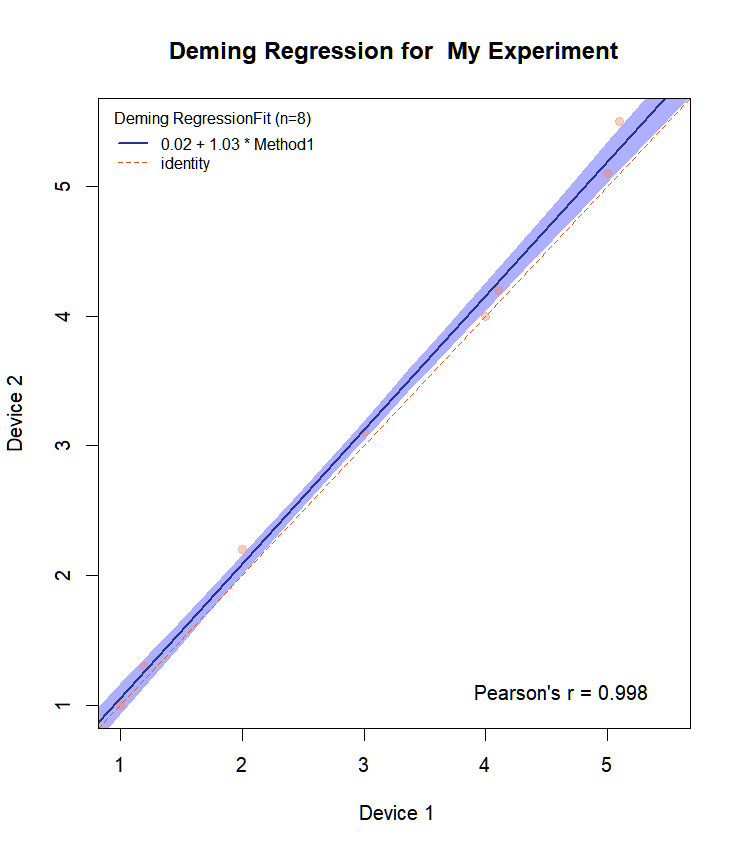
We zien dat de bovenstaande overeenkomst bijna perfect is voor deze speelgoedgegevens. Helling is gelijk aan 1 met CI: 0,97-1,09. De functie MCResult.plot plot standaard ook de betrouwbaarheidsgrenzen in de gekozen kleur. Ook wordt de vergelijking in de plot gezet.
Als je ook de CI voor de helling en het intercept op de plot wilt zetten, is hier de aanpassing van de functie MCResult.plot():
MCResult.plot2 0 & alpha = lengte(namen(cijfers))
  if (is.null(digits$coef)) {
    cijfers$coef <- 2
  }
  if (is.null(digits$cor)) {
    digits$cor <- 3
  }
  cor.method <- match.arg(cor.method)
  stopifnot(is.element(cor.method, c("pearson", "kendall",
                                     "spearman"))
  legenda.plaats  1)
    stopifnot(length(points.col) == nrow(x@data))
  if (lengte(points.pch) > 1)
    stopifnot(length(points.pch) == nrow(x@data))
  als (x@regmeth == "LinReg")
    titel <- "Lineaire regressie".
  anders als (x@regmeth == "WLinReg")
    titel <- "Gewogen lineaire regressie".
  anders als (x@regmeth == "TS")
    titel <- "Theil-Sen Regressie".
  anders als (x@regmeth == "PBequi")
    titel <- "Equivariante Passing-Bablok Regressie".
  anders als (x@regmeth == "Deming")
    titel <- "Deming Regressie".
  anders als (x@regmeth == "WDeming")
    titel <- "Gewogen Deming Regressie".
  anders titel <- "Passing Bablok Regressie".
  mooiblauw <- rgb(37/255, 52/255, 148/255)
  niceor <- rgb(230/255, 85/255, 13/255)
  niceblue.bounds <- rgb(236/255, 231/255, 242/255)
  als (is.null(reg.col))
    reg.col <- niceblue
  if (is.null(identity.col))
    identity.col <- niceor
  if (is.null(ci.area.col))
    ci.area.col <- niceblue.bounds
  if (is.null(ci.border.col))
    ci.border.col  1)
  als (is.null(xlim))
    rx <- range(x@data[, "x"], na.rm = TRUE)
  anders rx <- xlim
  tmp.range <- range(as.vector(x@data[, c("x", "y")]), na.rm = TRUE)
  als (equal.axis == TRUE) {
    if (is.null(ylim)) {
      yrange <- tmp.range
    }
    anders {
      yrange <- ylim
    }
  }
  anders {
    if (is.null(ylim)) {
      yrange <- range(as.vector(x@data[, "y"]), na.rm = TRUE)
    }
    anders {
      yrange <- ylim
    }
  }
  if (!is.null(xlim) && is.null(ylim) && equal.axis) {
    xlim <- c(min(c(xlim[1], ylim[1])), max(c(xlim[2], ylim[2]))
  }
  if (is.null(xaxp)) {
    if (!is.null(xlim)) {
      axis_ticks <- axisTicks(c(xlim[1] - 0.05 * xlim[2],
                                plafond((xlim[2] + 0,05 * xlim[2]) * 10^digits$coef)/10^digits$coef),
                              log = F, nint = 7)
      xaxp <- c(axis_ticks[1], tail(axis_ticks, n = 1),
                lengte(as_ticks) - 1)
      xlim <- c(axis_ticks[1], tail(axis_ticks, n = 1))
    }
  }
  anders {
    als (!is.null(xlim)) {
      if ((xlim[1] == rx[1] && xlim[2] == rx[2]) | (tmp.range[1] ==
                                                    xlim[1] && tmp.range[2] == xlim[2])) {
        xlim <- c(xaxp[1], xaxp[2])
      }
    }
    anders {
      waarschuwing("xaxp mag nooit worden ingesteld zonder xlim")
      xaxp <- NULL
    }
  }
  if (is.null(yaxp)) {
    if (!is.null(ylim) && !equal.axis) {
      yaxp <- axis_ticks <- axisTicks(c(ylim[1] - 0.05 *
                                          ylim[2], ceiling((ylim[2] + 0,05 * ylim[2]) *
                                                             10^digits$coef)/10^digits$coef), log = F, nint = 10)
      yaxp = c(axis_ticks[1], tail(axis_ticks, n = 1),
               lengte(as_ticks) - 1)
      ylim <- c(axis_ticks[1], tail(axis_ticks, n = 1))
    }
    anders {
      als (equal.axis) {
        als (!is.null(xlim)) {
          yaxp <- xaxp
          ylim <- xlim
        }
      }
    }
  }
  else {
    als (!is.null(ylim)) {
      if ((ylim[1] == yrange[1] && ylim[2] == yrange[2]) |
          (tmp.range[1] == ylim[1] && tmp.range[2] == ylim[2])) {
        ylim <- c(yaxp[1], yaxp[2])
      }
    }
    anders {
      waarschuwing("yaxp mag nooit worden ingesteld zonder ylim")
      yaxp <- NULL
    }
  }
  if (equal.axis) {
    if (is.null(ylim)) {
      yaxp <- xaxp
      ylim <- xlim
    }
    if (is.null(xlim)) {
      xaxp <- yaxp
      xlim <- ylim
    }
  }
  if (!is.null(xlim)) {
    if (xlim[1] < tmp.range[1]) {
      tmp.range[1]  tmp.range[2]) {
      tmp.range[2] <- xlim[2]
    }
  }
  if (!is.null(ylim)) {
    if (ylim[1] < yrange[1]) {
      yrange[1]  yrange[2]) {
      yrange[2] <- ylim[2]
    }
  }
  xd <- seq(rx[1], rx[2], length.out = xn)
  xd <- union(xd, rx)
  delta <- abs(rx[1] - rx[2])/xn
  xd <- xd[volgorde(xd)]
  xd.add <- c(xd[1] - delta * 1:10, xd, xd[lengte(xd)] + delta *
                1:10)
  als (is.null(xlim))
    xlim <- rx
  als (ci.area == TRUE | ci.border == TRUE) {
    bounds <- calcResponse(x, alpha = alpha, x.levels = xd)
    bounds.add <- calcResponse(x, alpha = alpha, x.levels = xd.add)
    als (equal.axis == TRUE) {
      xd <- seq(tmp.range[1], tmp.range[2], lengte.uit = xn)
      xd <- union(xd, tmp.range)
      delta <- abs(rx[1] - rx[2])/xn
      xd <- xd[volgorde(xd)]
      xd.add <- c(xd[1] - delta * 1:10, xd, xd[lengte(xd)] +
                    delta * 1:10)
      grenzen <- calcResponse(x, alpha = alpha, x.levels = xd)
      bounds.add <- calcResponse(x, alpha = alpha, x.levels = xd.add)
      yrange <- range(c(as.vector(x@data[, c("x", "y")]),
                        as.vector(grenzen[, c("X", "Y", "Y.LCI", "Y.UCI")]),
                      na.rm = TRUE)
    }
    anders {
      yrange <- range(c(as.vector(x@data[, "y"]), as.vector(bounds[,
                                                                   c("Y", "Y.LCI", "Y.UCI")]), na.rm = TRUE)
    }
  }
  anders {
    als (equal.axis == TRUE) {
      yrange <- tmp.range
    }
    anders {
      yrange <- range(as.vector(x@data[, "y"]), na.rm = TRUE)
    }
  }
  if (equal.axis) {
    if (is.null(ylim)) {
      xlim <- ylim <- tmp.range
    }
    anders {
      xlim <- ylim
    }
  }
  anders {
    als (is.null(xlim))
      xlim <- rx
    if (is.null(ylim))
      ylim <- yrange
  }
  if (is.null(main))
    main <- paste(titname, "Fit")
  als (!add) {
    plot(0, 0, cex = 0, ylim = ylim, xlim = xlim, xlab = x.lab,
         ylab = y.lab, main = main, sub = "", xaxp = xaxp,
         yaxp = yaxp, bty = "n", ...)
  }
  anders {
    sub <- ""
    legenda toevoegen <- FALSE
    raster toevoegen <- FALSE
  }
  if (add.legend == TRUE) {
    if (identity == TRUE & reg == TRUE) {
      tekst2 <- "identiteit"
      text1 <- paste(formatC(round(x@para["Intercept",
                                          "EST"], digits = digits$coef), digits = digits$coef,
                             formaat = "f"),"(",formatC(rond(x@para["Intercept",
                                                                    "LCI"], digits = digits$coef), digits = digits$coef,
                                                       formaat = "f"),";",formatC(rond(x@para["Intercept",
                                                                                          "UCI"], digits = digits$coef), digits = digits$coef,
                                                                             format = "f"),")"," + ", formatC(round(x@para["Helling",
                                                                        "EST"], digits = digits$coef), digits = digits$coef,
                                                           formaat = "f"),"(",formatC(rond(x@para["Helling",
                                                                                                  "LCI"], digits = digits$coef), digits = digits$coef,
                                                                                     formaat = "f"),";",formatC(rond(x@para["Helling",
                                                                                                                        "UCI"], digits = digits$coef), digits = digits$coef,
                                                                                                           formaat = "f"),")" ," * ", x@namen[1], sep = "")
      legenda(legenda.plaats, lwd = c(reg.lwd, identity.lwd),
             lty = c(reg.lty, identity.lty), col = c(reg.col,
                                                     identity.col), title = paste(titname, "Fit (n=",
                                                                                  dim(x@data)[1], ")", sep = ""), legenda = c(text1,
                                                                                                                             tekst2), box.lty = "blanco", cex = 0.8, bg = "wit",
             inzet = c(0,01, 0,01))
    }
    if (identity == TRUE & reg == FALSE) {
      tekst2 <- "identiteit"
      legenda(legenda.plaats, lwd = identity.lwd, lty = identity.lty,
             col = identity.col, title = paste(titname, "Fit (n=",
                                               dim(x@data)[1], ")", sep = ""), legenda = text2,
             box.lty = "blanco", cex = 0.8, bg = "wit", inzet = c(0.01,
                                                                   0.01))
    }
    if (identity == FALSE & reg == TRUE) {
      text1 <- paste(formatC(round(x@para["Intercept",
                                          "EST"], digits = digits$coef), digits = digits$coef,
                             formaat = "f"), "+", formatC(round(x@para["Helling",
                                                                      "EST"], digits = digits$coef), digits = digits$coef,
                                                         formaat = "f"), "*", x@namen[1], sep = "")
      legenda(legenda.plaats, lwd = c(2), col = c(reg.col),
             titel = paste(titname, "Fit (n=", dim(x@data)[1],
                           ")", sep = ""), legenda = c(text1), box.lty = "blanco",
             cex = 0,8, bg = "wit", inzet = c(0,01, 0,01))
    }
  }
  als (ci.area == TRUE | ci.border == TRUE) {
    als (ci.area == TRUE) {
      xxx <- c(xd.add, xd.add[order(xd.add, decreasing = TRUE)])
      yy1 <- c(as.vector(bounds.add[, "Y.LCI"]))
      yy2 <- c(as.vector(bounds.add[, "Y.UCI"]))
      yyy <- c(yy1, yy2[volgorde(xd.add, aflopend = TRUE)])
      veelhoek(xxx, yyy, col = ci.area.col, rand = "wit",
              lty = 0)
    }
    als (add.grid)
      raster()
    als (ci.border == TRUE) {
      punten(xd.add, bounds.add[, "Y.LCI"], lty = ci.border.lty,
             lwd = ci.border.lwd, type = "l", col = ci.border.col)
      punten(xd.add, bounds.add[, "Y.UCI"], lty = ci.border.lty,
             lwd = ci.border.lwd, type = "l", col = ci.border.col)
    }
    if (is.null(sub)) {
      als (x@cimeth %in% c("bootstrap", "nestedbootstrap"))
        subtekst <- plakken("De ", 1 - x@alpha, "-betrouwbaarheidsgrenzen zijn berekend met de ",
                         x@cimeth, "(", x@bootcimeth, ") methode.", sep = "")
      anders als ((x@regmeth == "PaBa") & (x@cimeth == "analytisch"))
        subtekst <- ""
      else subtekst <- paste("De ", 1 - x@alpha, "-betrouwbaarheidsgrenzen zijn berekend met de ",
                            x@cimeth, " methode.", sep = "")
    }
    else subtekst <- sub
  }
  else {
    als (add.grid)
      raster()
    subtekst <- ifelse(is.null(sub), "", sub)
  }
  if (add.cor == TRUE) {
    cor.coef <- paste(formatC(round(cor(x@data[, "x"], x@data[,
                                                              "y"], use = "pairwise.complete.obs", method = cor.method),
                                    cijfers = cijfers$cor), cijfers = cijfers$cor, formaat = "f")
    als (cor.method == "pearson")
      cortext <- paste("Pearson's r = ", cor.coef, sep = "")
    als (cor.method == "kendall")
      cortext <- bquote(paste("Kendall's ", tau, " = ",
                              .(cor.coef), sep = ""))
    als (cor.method == "spearman")
      cortext <- bquote(paste("Spearman's ", rho, " = ",
                              .(cor.coef), sep = "")
    mtext(side = 1, line = -2, cortext, adj = 0,9, font = 1)
  }
  if (draw.points == TRUE) {
    punten(x@data[, 2:3], col = points.col, pch = points.pch,
           cex = punten.cex, ...)
  }
  titel(sub = subtekst)
  als (reg == TRUE) {
    b0 <- x@para["Intercept", "EST"]
    b1 <- x@para["Helling", "EST"]
    abline(b0, b1, lty = reg.lty, lwd = reg.lwd, col = reg.col)
  }
  if (identity == TRUE) {
    abline(0, 1, lty = identity.lty, lwd = identity.lwd,
           col = identity.col)
  }
  box()
}
Als we de functie nu veranderen:
Draw.Deming.Plot<-functie(resp1,resp2,naam1){
  #mcreg accepteert geen NA's
  df<-as.data.frame(cbind(resp1,resp2))
  df2<-df[complete.cases(df),]
  dem.reg <- mcreg(df2$resp1,df2$resp2, error.ratio = 1, method.reg = "Deming")
  MCResult.plot2(dem.reg, equal.axis = TRUE, x.lab = " Apparaat 1", y.lab = "Apparaat 2", points.col = "#FF7F5060", points.pch = 19, ci.area = TRUE, ci.area.col = "#0000FF50", main = paste("Deming Regression for ",name1), sub = "", add.grid = FALSE, points.cex = 1)
  return(list(intercept=c(dem.reg@para[1,c(1,3,4)]),slope=c(dem.reg@para[2,c(1,3,4)]))
}
En we bellen:
Draw.Deming.Plot(resp1,resp2,"Mijn experiment")Dan krijgen we:
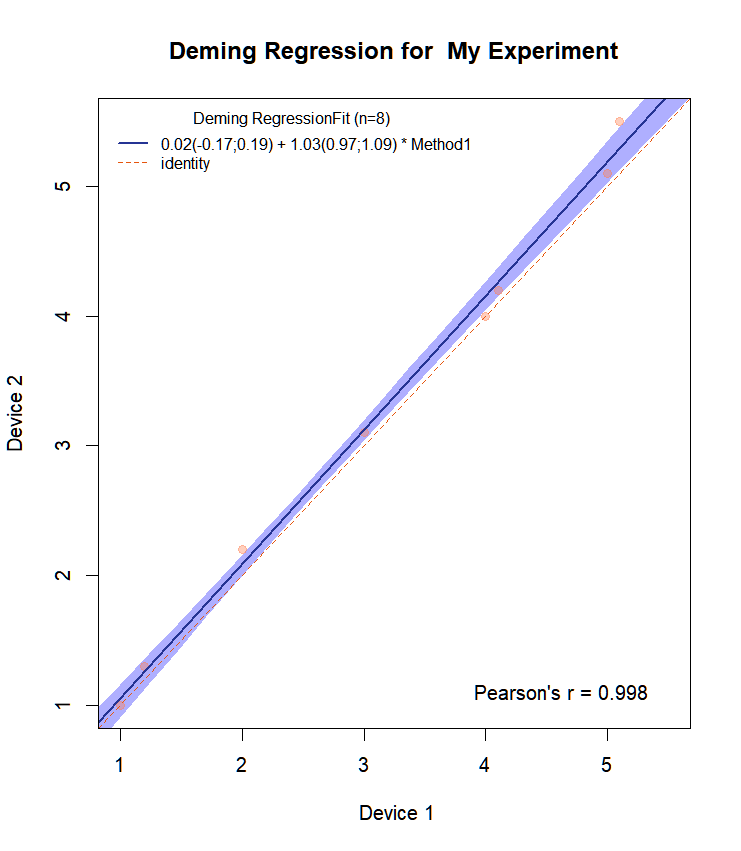
Het heeft nu alle CI voor de helling en het intercept op de plot.
Veel plezier!